Measuring the Resurgence at Government Spring
2008-2012
Measuring the Resurgence at Government Spring 2008-2012 |
This page shows our first attempts to measure the output of Government Spring in 2012. A plywood weir was placed in the spring pool for 4 years before a Rio Bonito flood took it out. The home-made depth logger did not work or last very long, and was the incentive to purchase a set of In-Situ professional data loggers for placement in Snowy River. Finally a well point and data logger were installed in the spring in 2018.
|
||||
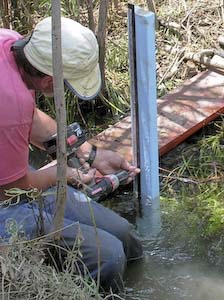
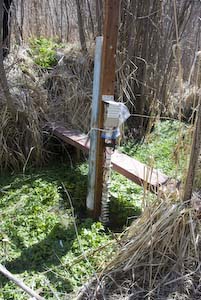
Installing the new Gov. Spring scale on the 2 x 4 which is coated with a blue paint to minimize water absorption. |
 |
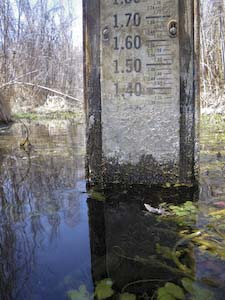
The water gauge at the old gauging station is marked in 10ths of feet, taken from the stream to the right. |
 |
|
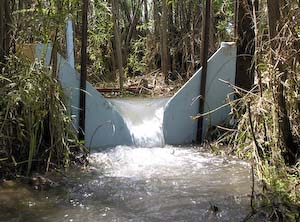
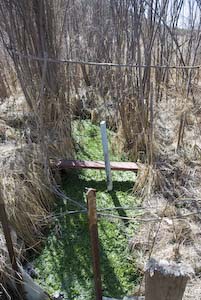
Side view of the new gauging station: scale is on the 2 x 4 next to the bridge, weir to the right. |
 |
The weir is constructed from water-proofed plywood, held in place by two steel posts plus other wood supports. |
 |
|
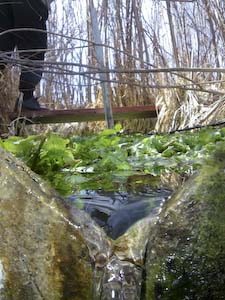
A view at low water looking towards the spring. Note the water plants that tend to clog the "V" notch of the weir. Also note the clarity of the water. |
 |
A view towards the actual spring from slightly downstream of the weir shows the long and narrow pool surrounded by willow trees. |
 |
|
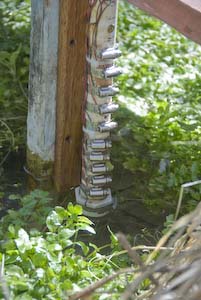
The top of the sensor is where the data logger is attached. A plastic bag and a metal cover is used for environmental protection. |
 |
The sensor was positioned so that the main lower band plus the next copper band was just at the low flow water level of 1 3/16 inch on the scale. |
 |
|
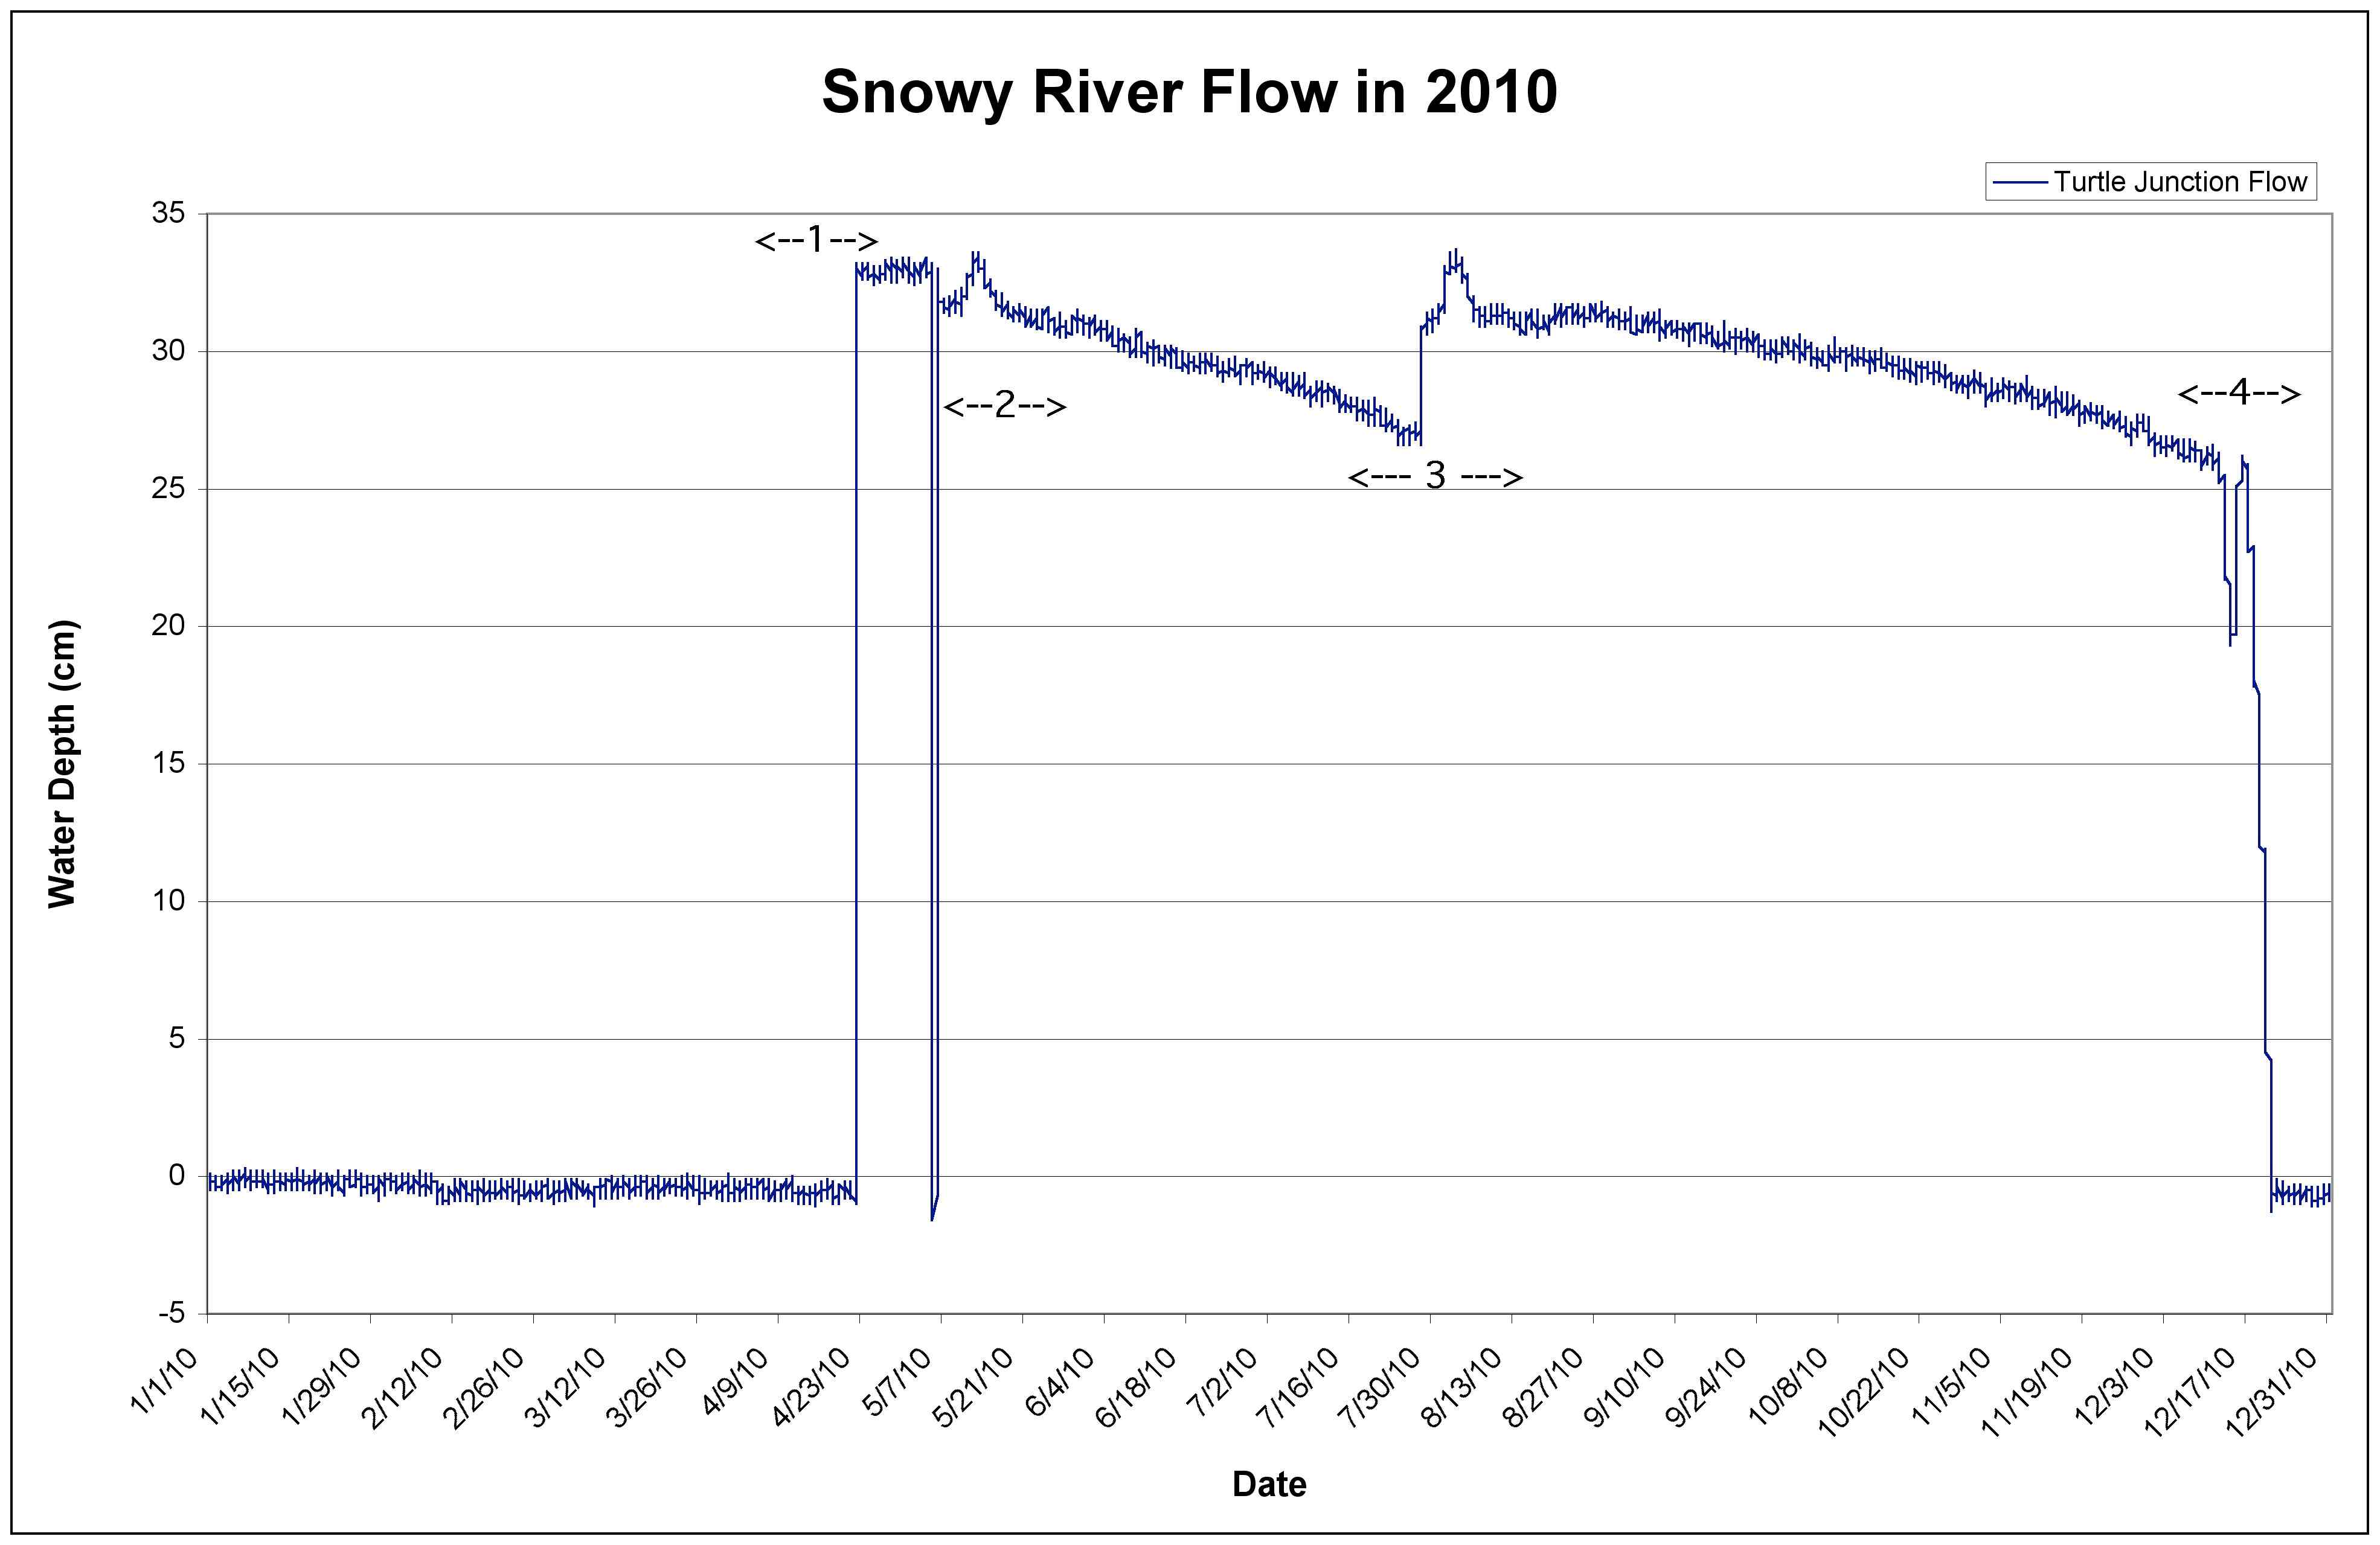
The graph on the right is a record of the flow rate from a high flow in September, 2008 to low flow in April, 2012. The peaks correlate with flows at Turtle Junction in Snowy River. |
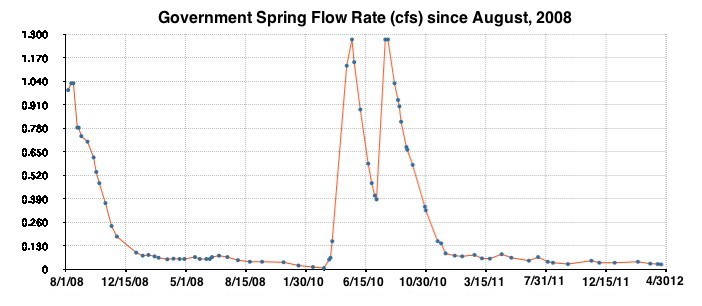 |
Shortly after the Turtle Junction flow started in 2010 (#1), the data logger was removed to download data, then it was replaced at a slightly shallower location. Shortly after that point there was a rain event (#2). In the late July to early August time period heavy surface rain caused a 2nd water event (#3). Then in the middle of December 2010, the water flow stopped shortly after a 3rd water event (#4) that lasted only a day or so. Over about a week the depth seemed to dip about 6 cm, then rise back to the previous flow level before tapering off back to the “no flow” condition. |
 |
April 2015 Government Spring Video (10.3 MB MP4 file) |
|
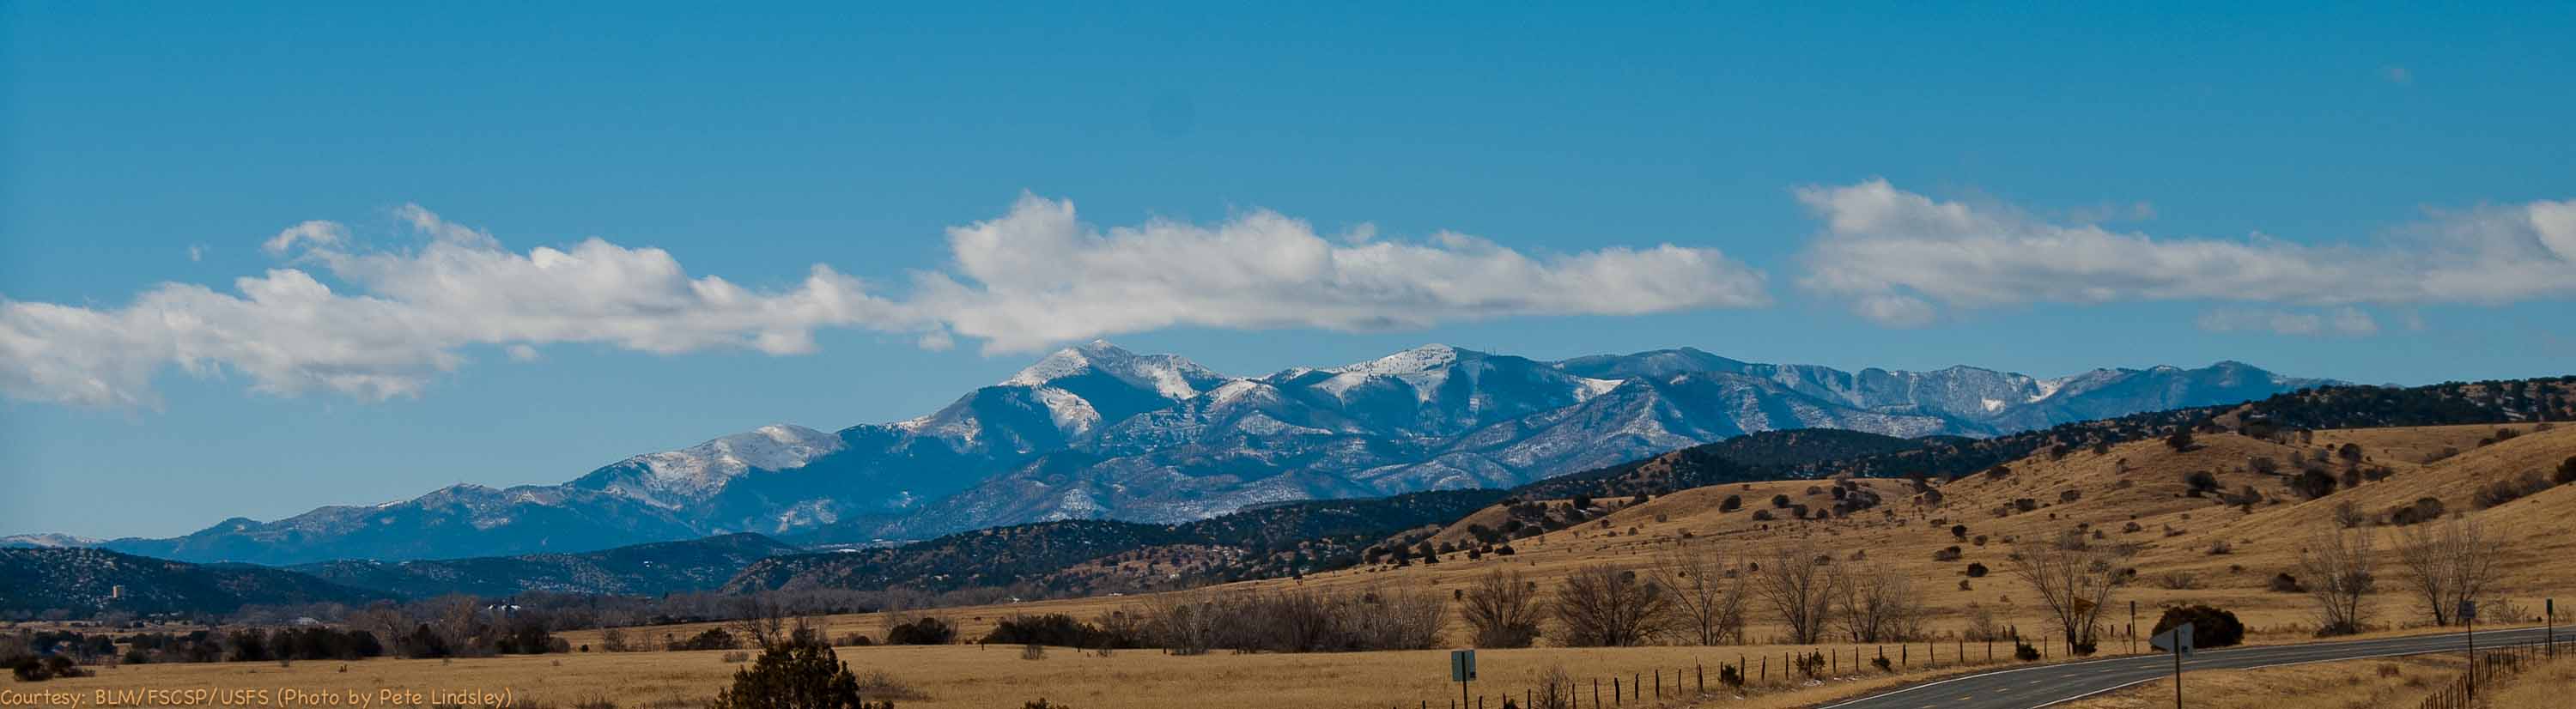
Sierra Blanca is the primary source of the rainfall and snowfall that feeds the Fort Stanton Hydrology Area.
![]()
Rev. 4-25-2019 |
Comments to the webmaster |
Contact the FSCSP President |
Contact the Project Director |