FSCSP Analysis: Eagle Creek Flows
FSCSP Analysis: Eagle Creek Flows |
| Hydrogeology Home Page |
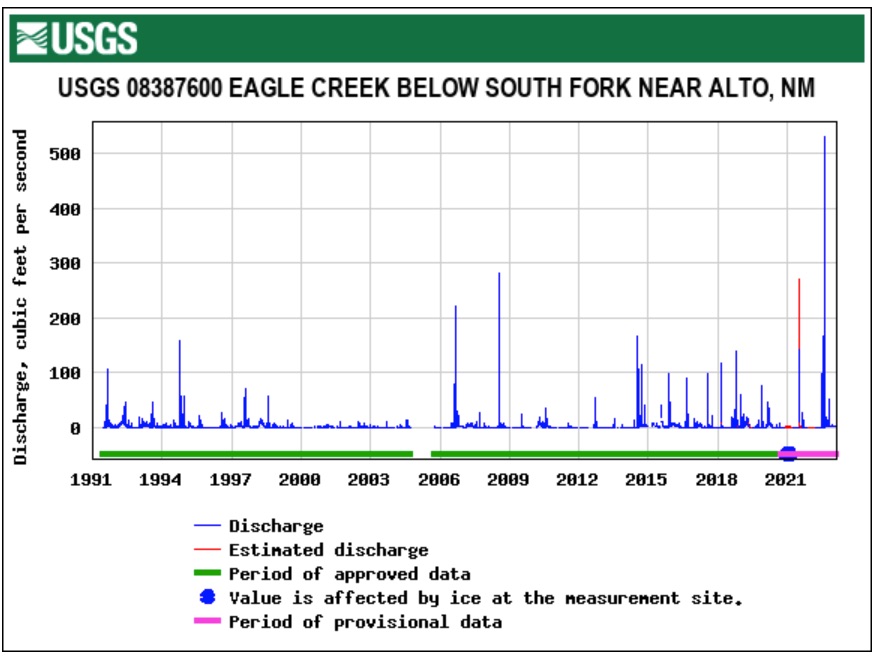
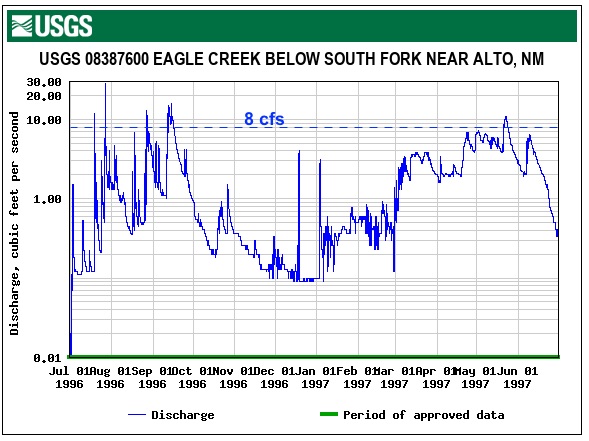
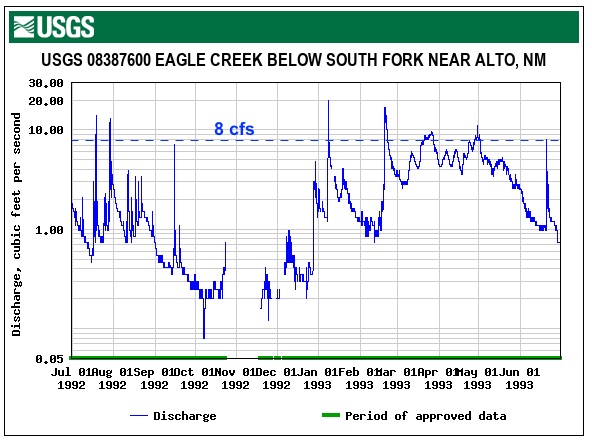
The previous web pages discussing the hydrology of Snowy River have focused on the cave, and the understanding of where the water comes from. Since the discovery of Snowy River in 2001 we have come to realize that at least most of the water originates from the rain and snowfall on Sierra Blanca. As we have explored and surveyed the cave, the passages do, indeed, continue to support this understanding. Four days after the unexpected 2008 Hurricane Dolly flood, which was mostly in Ruidoso, Government Spring was found to be flowing, and on inspection at Turtle Junction we found that Snowy River was also flowing enough to perform a water trace with the spring. Several home-made water loggers were thrown together and a Schlumberger Baro and Water Logger unit was purchased and placed at Turtle Junction. Then in 2010, following heavy rains, we again experienced a Snowy River flow at Turtle Junction that lasted for several months. Analysis of this Snowy River Water Flow first identified a time relationship between the rains measured at the Ruidoso Airport KSRR weather station and the arrival time of the water at Turtle Junction. It appeared that the 72-80 hour time lag between local rains and the flow at Turtle Junction was strongly related. But comparing the flow rate to a single weather station was much too simple for a hydrology system that likely covered a greatly expanded area. In 2012 we were able develop a plan for a more extensive measurement area in the cave, and in 2013 around a dozen professional data loggers were deployed. A 4-year flow started in 2014 and it would be a few years later before we obtained additional information. Additional loggers were added to the Fort Stanton Cave array, and the new loggers extended into the Main Corridor. Some loggers are deep enough in the cave that they have not yet been recovered since the 2013 deployment. As we continue to gather additional data from the cave and correlate it with USGS data from the 8387600 Eagle Creek gauging station, it is now of interest to look at the overall water flows monitored by this USGS station since 1991, a decade before the discovery of Snowy River. Steve Peerman has taken the lead in analyzing the relationship between the USGS Eagle Creek station and is also seeing a similar relationship ("most of the time"), but the hydrology is not a simple problem. Analysis continues. The following charts for the #8387600 Eagle Creek gauging station will give an idea of the "wet years". The vertical scales are adjusted to show the peak flows during the time graphed, so look carefully at the scale on the left side of the graph and understand that Snowy River appears to flow only after a certain volume of water enters the aquifer. Currently we believe that flows at this USGS station exceeding 8-10 cfs (cubic feet per second) are the most likely to fill the aquifer to the point where Snowy River actually flows. Other work continues that correlates the time deposition of the Snowy River calcite, some of which is mentioned in the bibliography. |
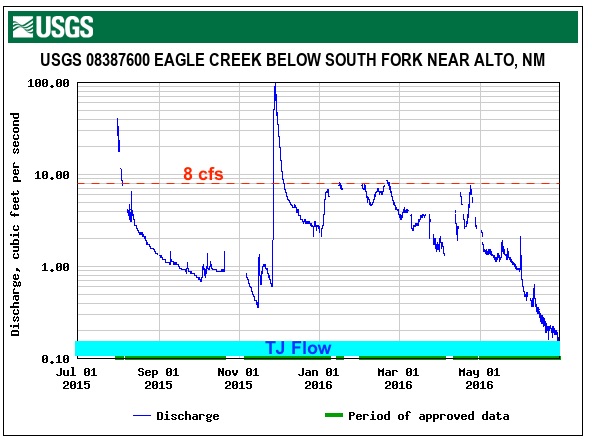
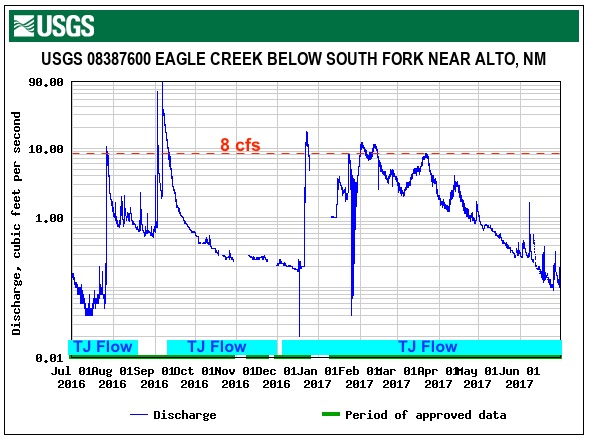
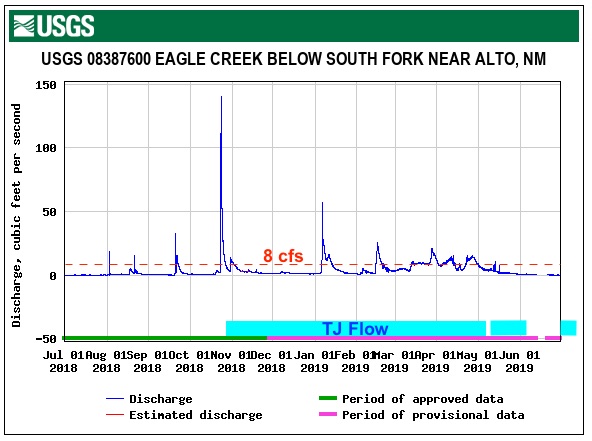
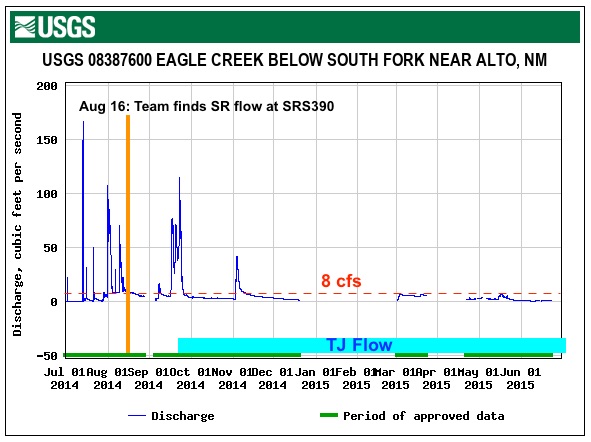
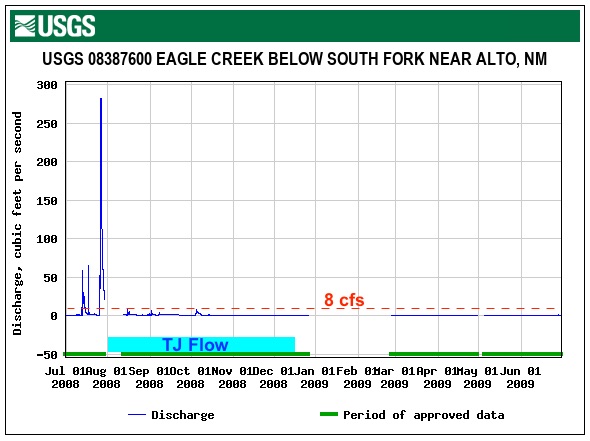
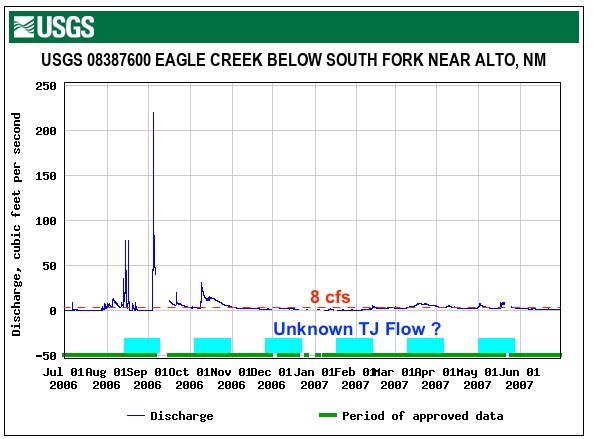
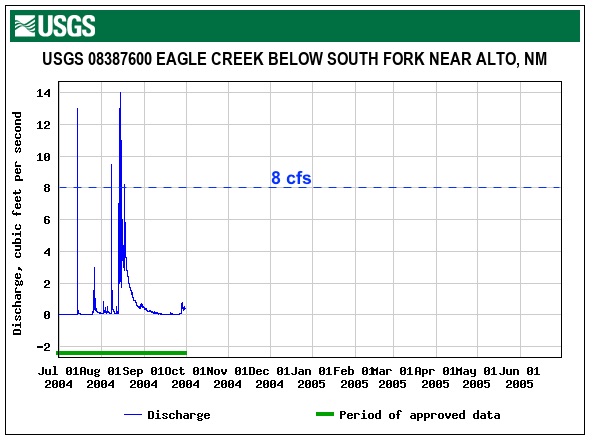
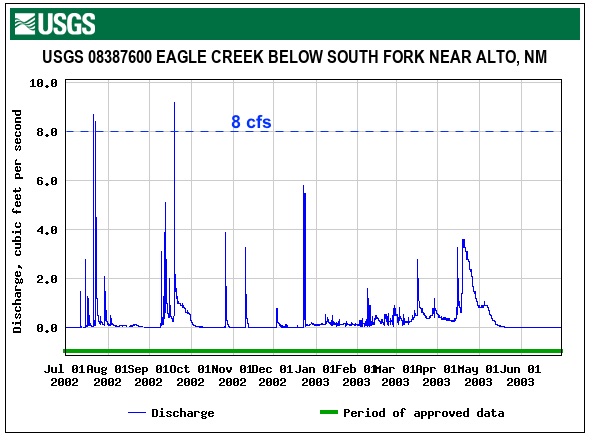
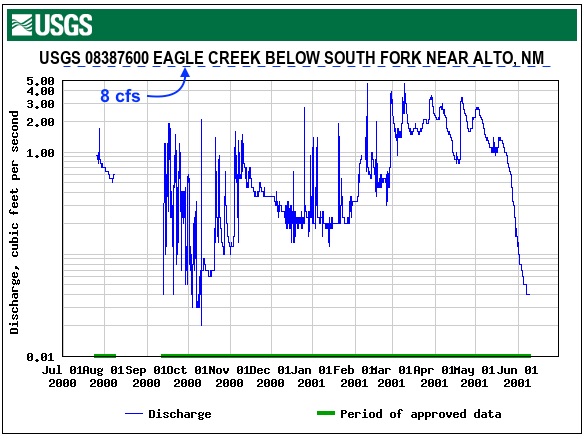
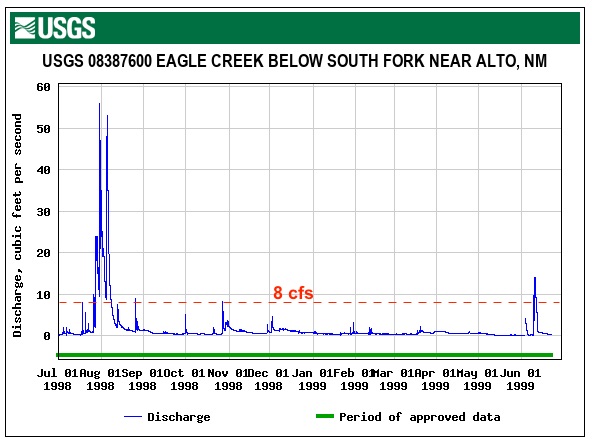
This is the second generation of this type of chart. Comments on the first iteration of this page were that it might be easier to understand if each "water year" was slightly adjusted to more closely agree with the NM "Monsoon" characteristics (smaller size local showers in various parts of the state generating "heavier" rainfall). In addition, on this page we have started to indicate some of the known flows at Turtle Junction. Previous charts attempting to convey 3-D or even 4-D type information were very complex and relied on limited colors to show flow characteristics over a multi-year period. As we gain more information from deployed data loggers this older type of graph was just not able to show the additional information that was easily understood by the casual observer. We hope the charts shown on this page will give some ideas to the area hydrologists and we look forward to further improvements in various ways of presenting some complex information over an ever-increasing area. Other types of "water prediction charts" have been based on measurements at just two points: the USGS Eagle Creek station #8387600 and Turtle Junction, the primary water data logging station in the cave that measures Snowy River. During the past year we have deployed other surface data logging stations, including Government Spring, and once we better understand these measurements we may be able to introduce additional surface information that could correlate with additional data loggers deployed in the cave. These charts are modified from the graphs available on the USGS web site mentioned above, and have an arbitrary dashed line added to the charts that shows an 8 cfs discharge level at the Eagle Creek station. (The auto-ranging graphs have various discharge scales, depending on the maximum discharge for each period.) The red dashed lines were used when we expected a flow at Turtle Junction, and the blue dashed lines indicate low probability of flow. |
32 Year Record of Eagle Creek Water Flows |
||
 |
||
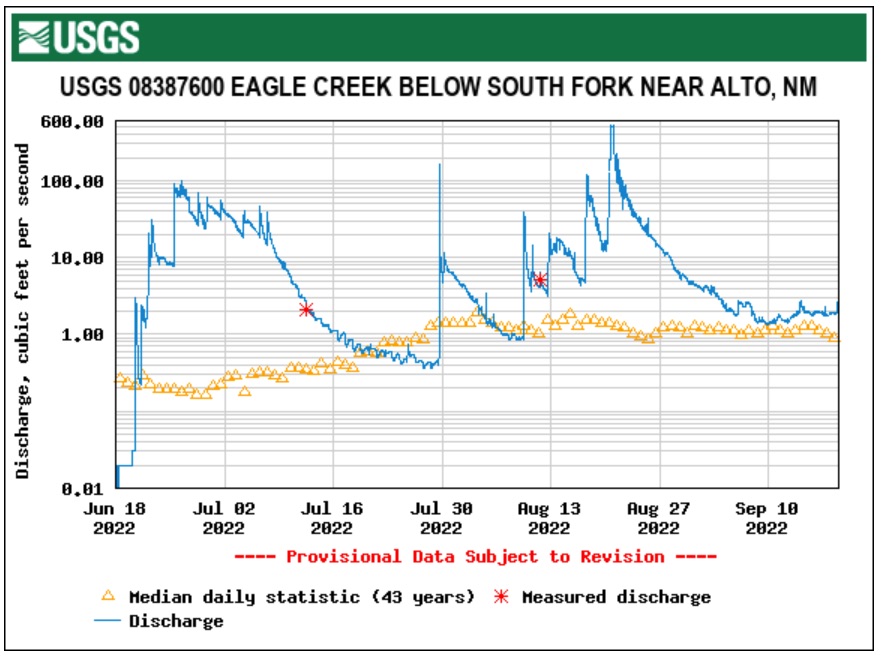
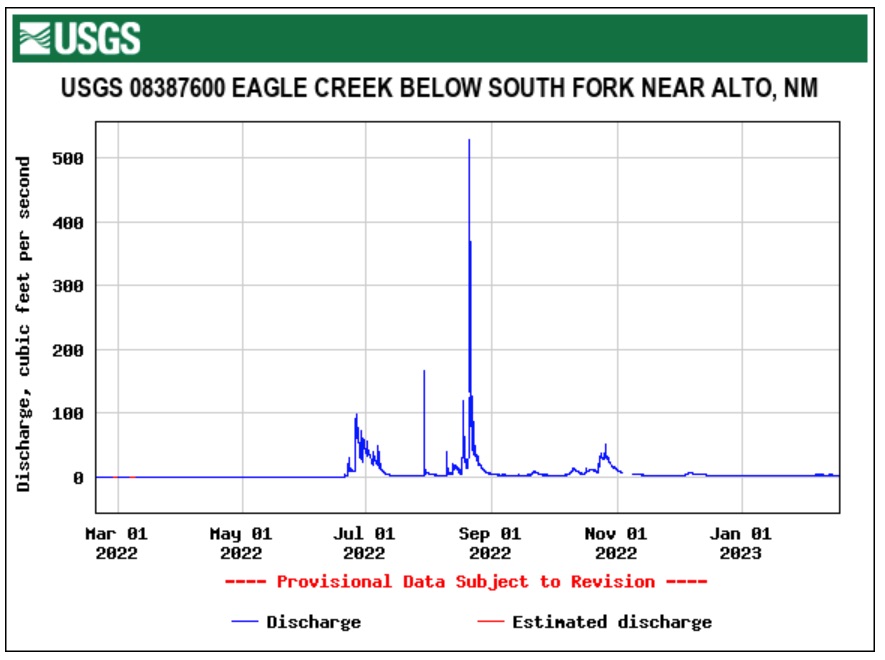
The chart on the right shows the Eagle Creek 8387600 Gauge experiencing a significant flow at the end of June, 2022. This was about the same time that a team of four were continuing the exploration of the Snowy River passage past the 4:30 AM Junction. Fortunately they completed their survey on July 1-3, and exited the cave probably a day or two before thee far south end of Snowy River started flowing. Several more significant flows started in mid August that continued the flow at Turtle Junction until at least the end of the season on October 31, 2022. We are somewhat skeptical of the high flow indicated in August, 2022. Check back later to see the times indicated of flows at Turtle Junction. |
July-2023 |
 |
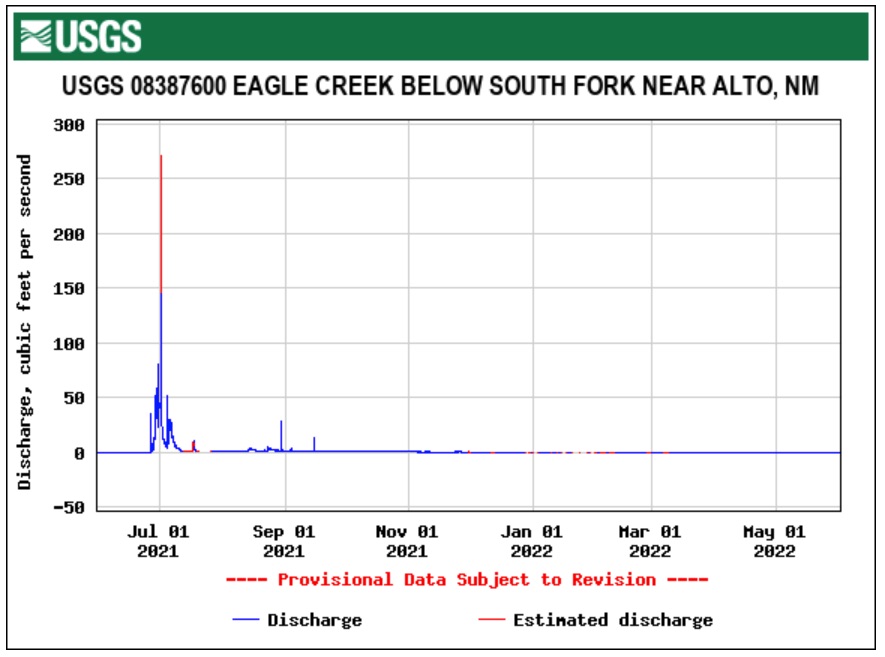 |
2021-2023 |
 |
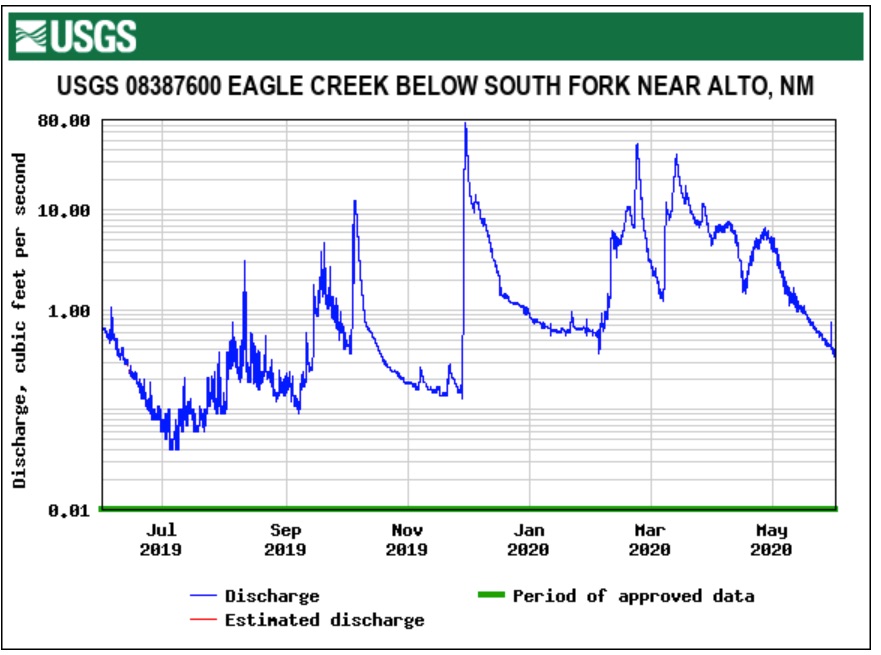 |
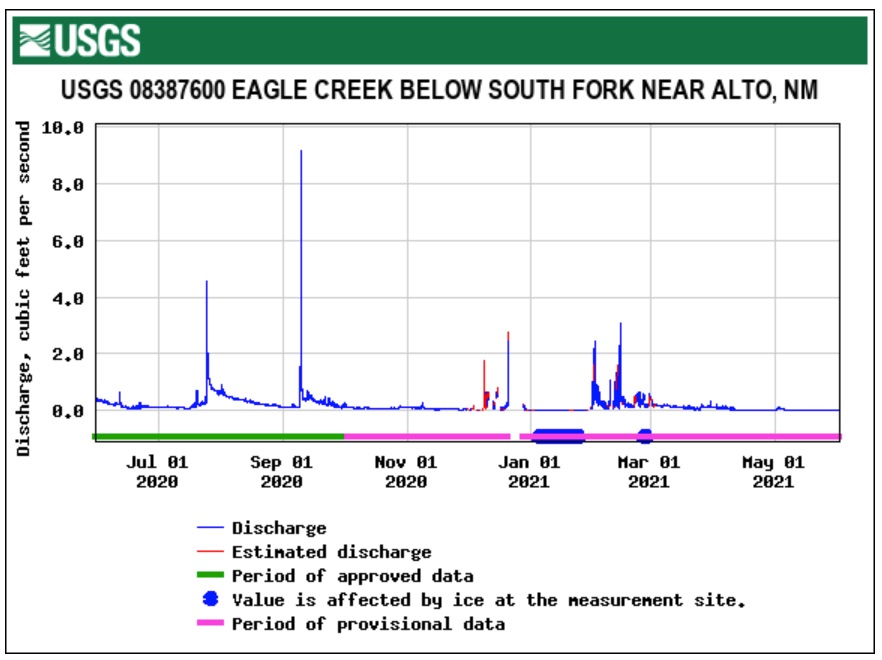
2019-2021 |
 |
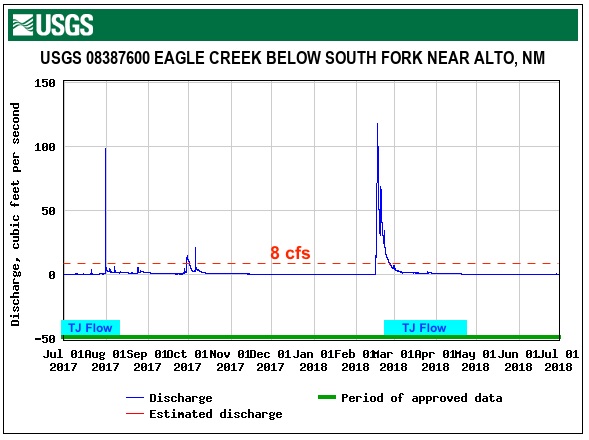 |
2017-2019 |
 |
|
2015-2017
|
|
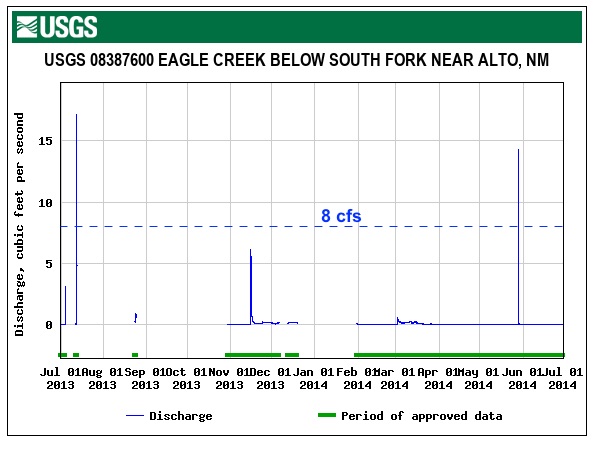 |
2013-2015
|
 |
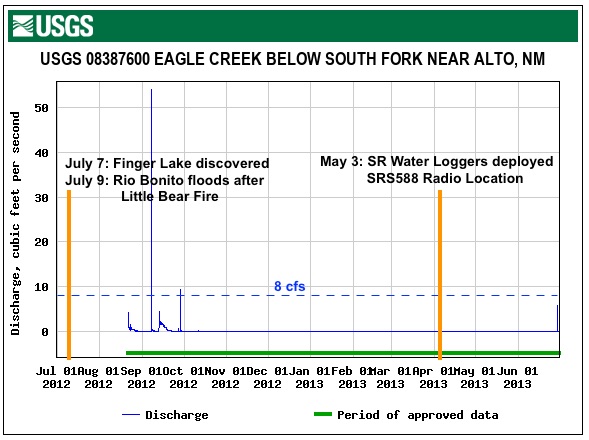
Following the Little Bear Fire and a Rio Bonito flood that covered the Government Spring pool with 14 inches of hard black mud, the hydrology seemed to change due to the reduced tree cover in the upper Eagle Creek areas. |
||
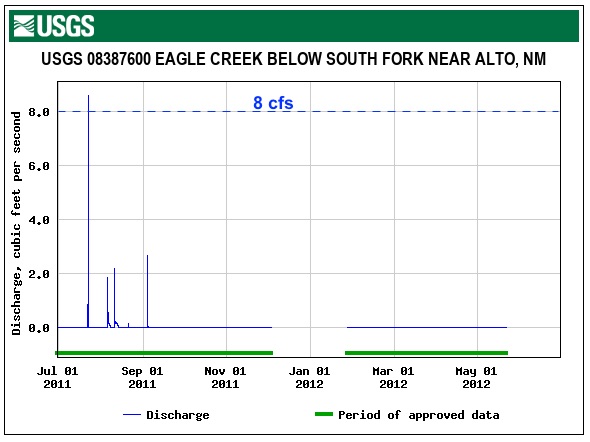 |
2011-2013
|
 |
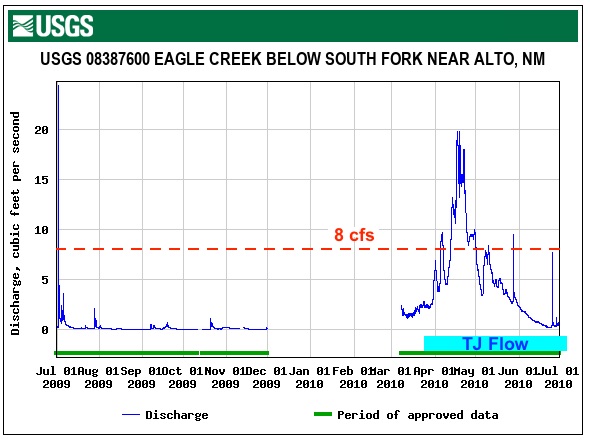 |
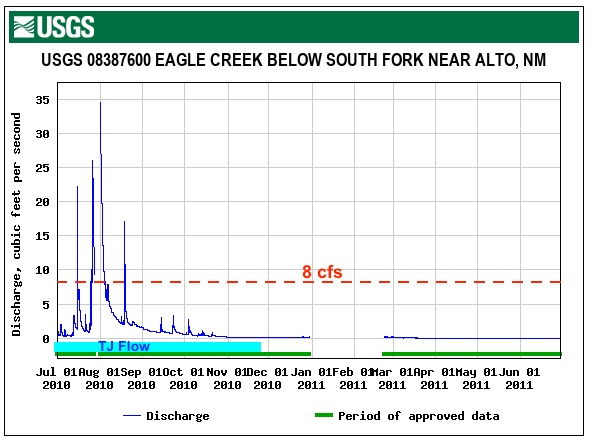
2009-2011
|
 |
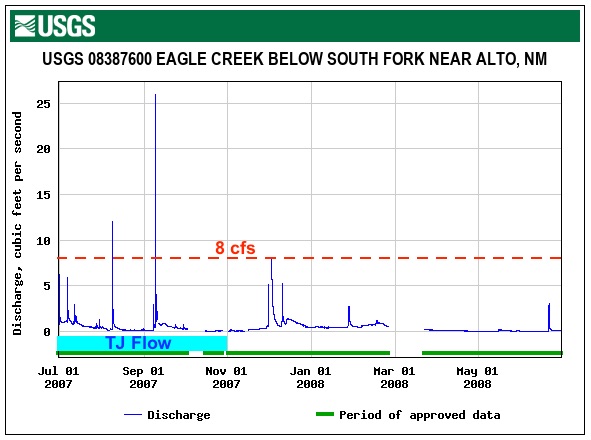 |
2007-2009
|
 |
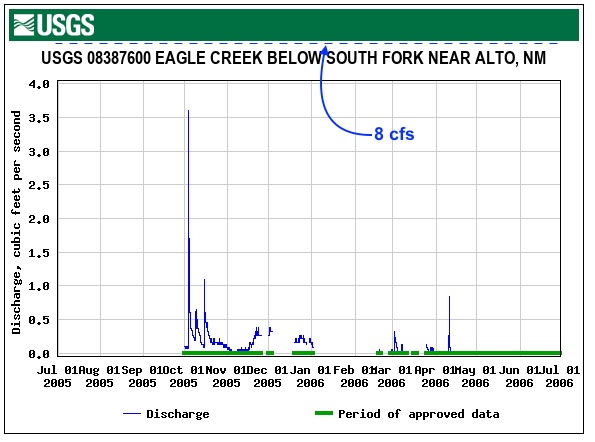 |
2005-2007
|
 |
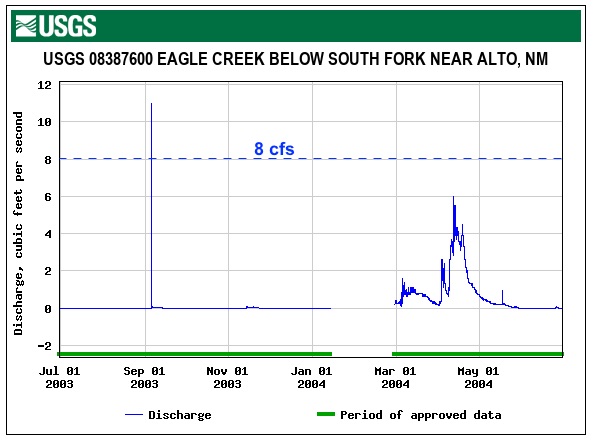 |
2003-2005 |
 |
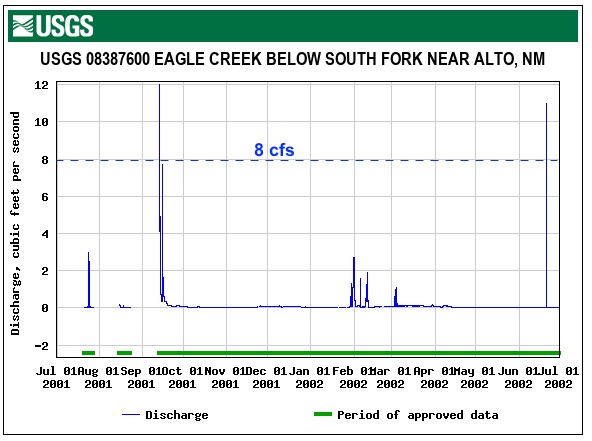 |
2001-2003 |
 |
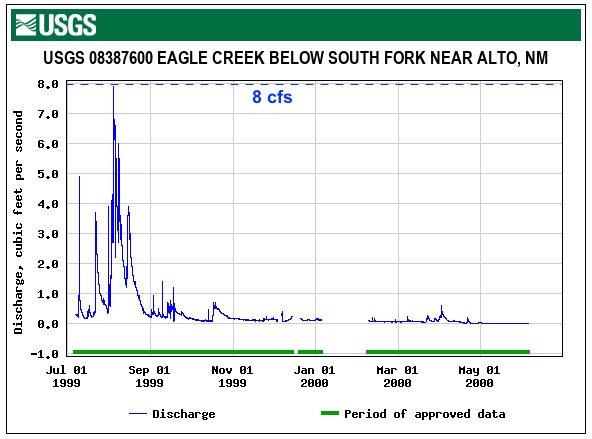 |
1999-2001 |
 |
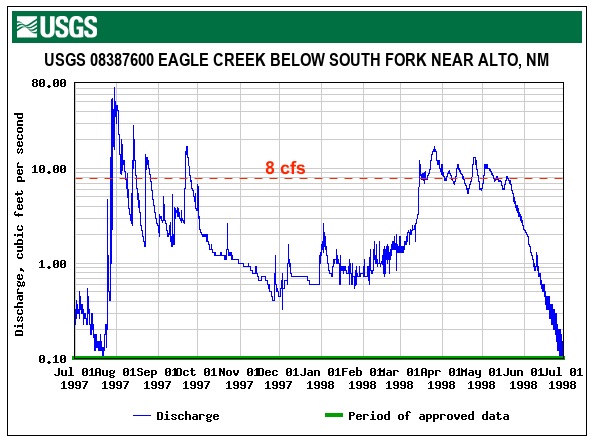 |
1997-1999 |
 |
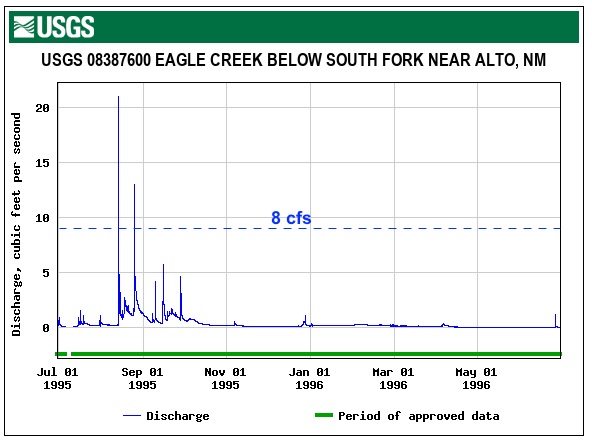 |
1995-1997 |
 |
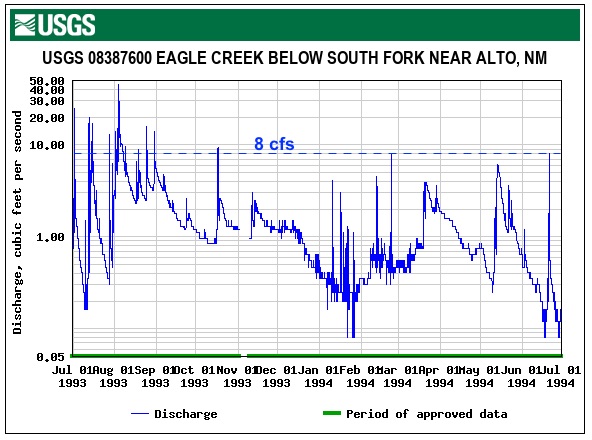 |
1993-1995 | 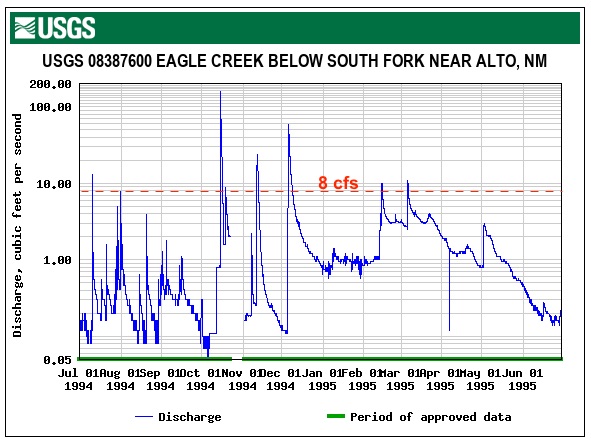 |
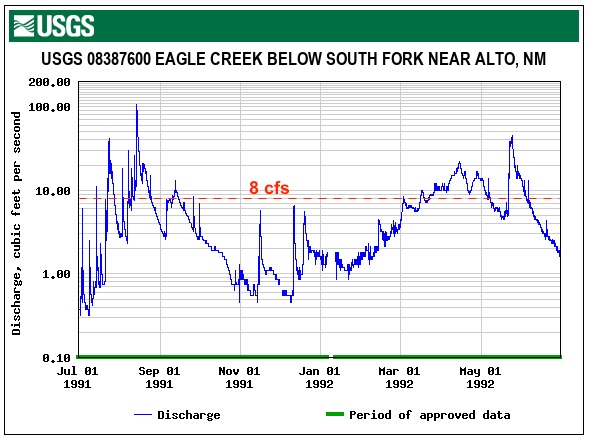 |
1991-1993 |
 |
Rev. 2-27-2023 |
Comments to the webmaster |
Contact the FSCSP President |
Contact the Project Director |